Tutorial for Bi3D with Isaac Sim
Overview
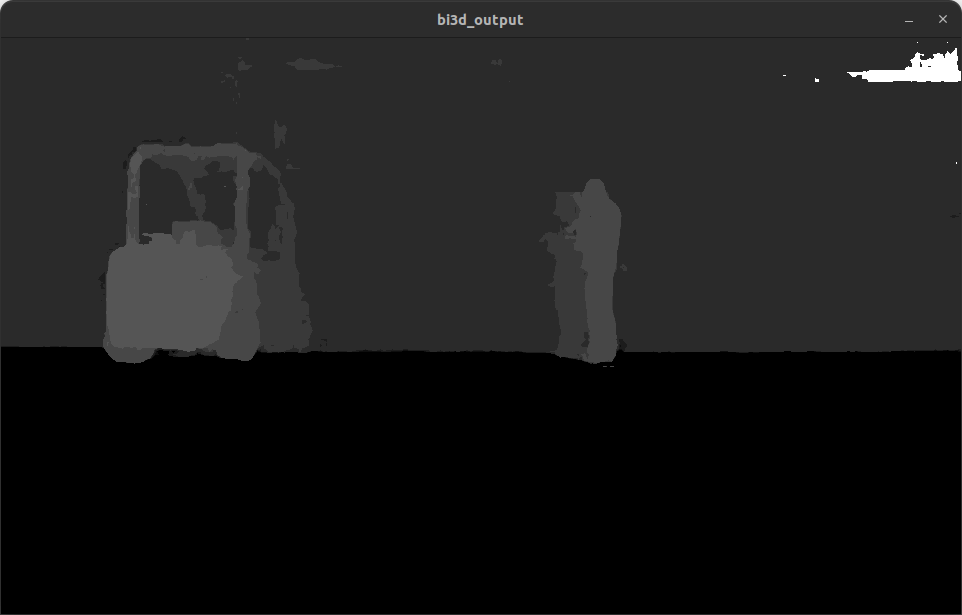
This tutorial walks through setting up a graph to segment stereo image pairs generated by Isaac Sim by depth disparity levels. For more details on the output, see interpreting the output section of the package reference.
Tutorial Walkthrough
Complete the steps listed in the Quickstart section of the package reference. Use the steps for Rosbag in the Run Launch File section of the quickstart.
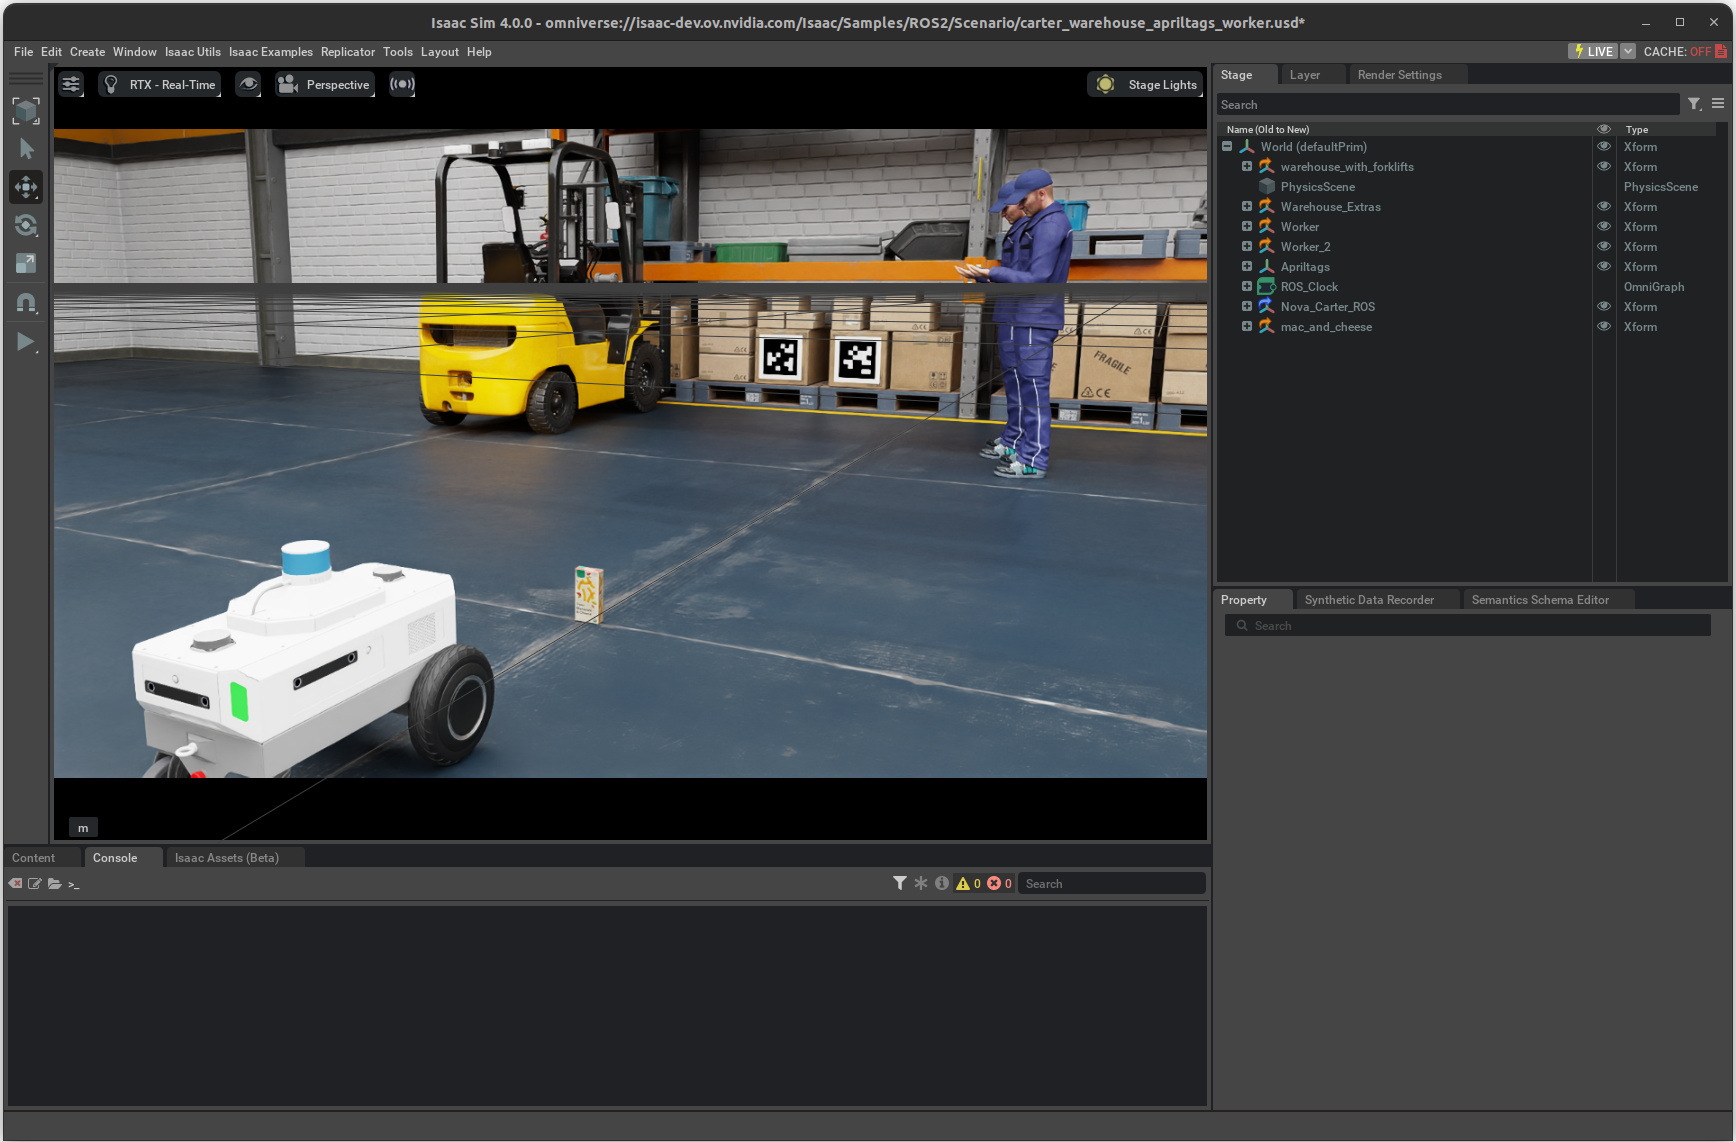
Install and launch Isaac Sim following the steps in the Isaac ROS Isaac Sim Setup Guide.
Press Play to start publishing data from the Isaac Sim.
Open a second terminal and attach to the container:
cd ${ISAAC_ROS_WS}/src/isaac_ros_common && \
./scripts/run_dev.sh
In the second terminal, start the
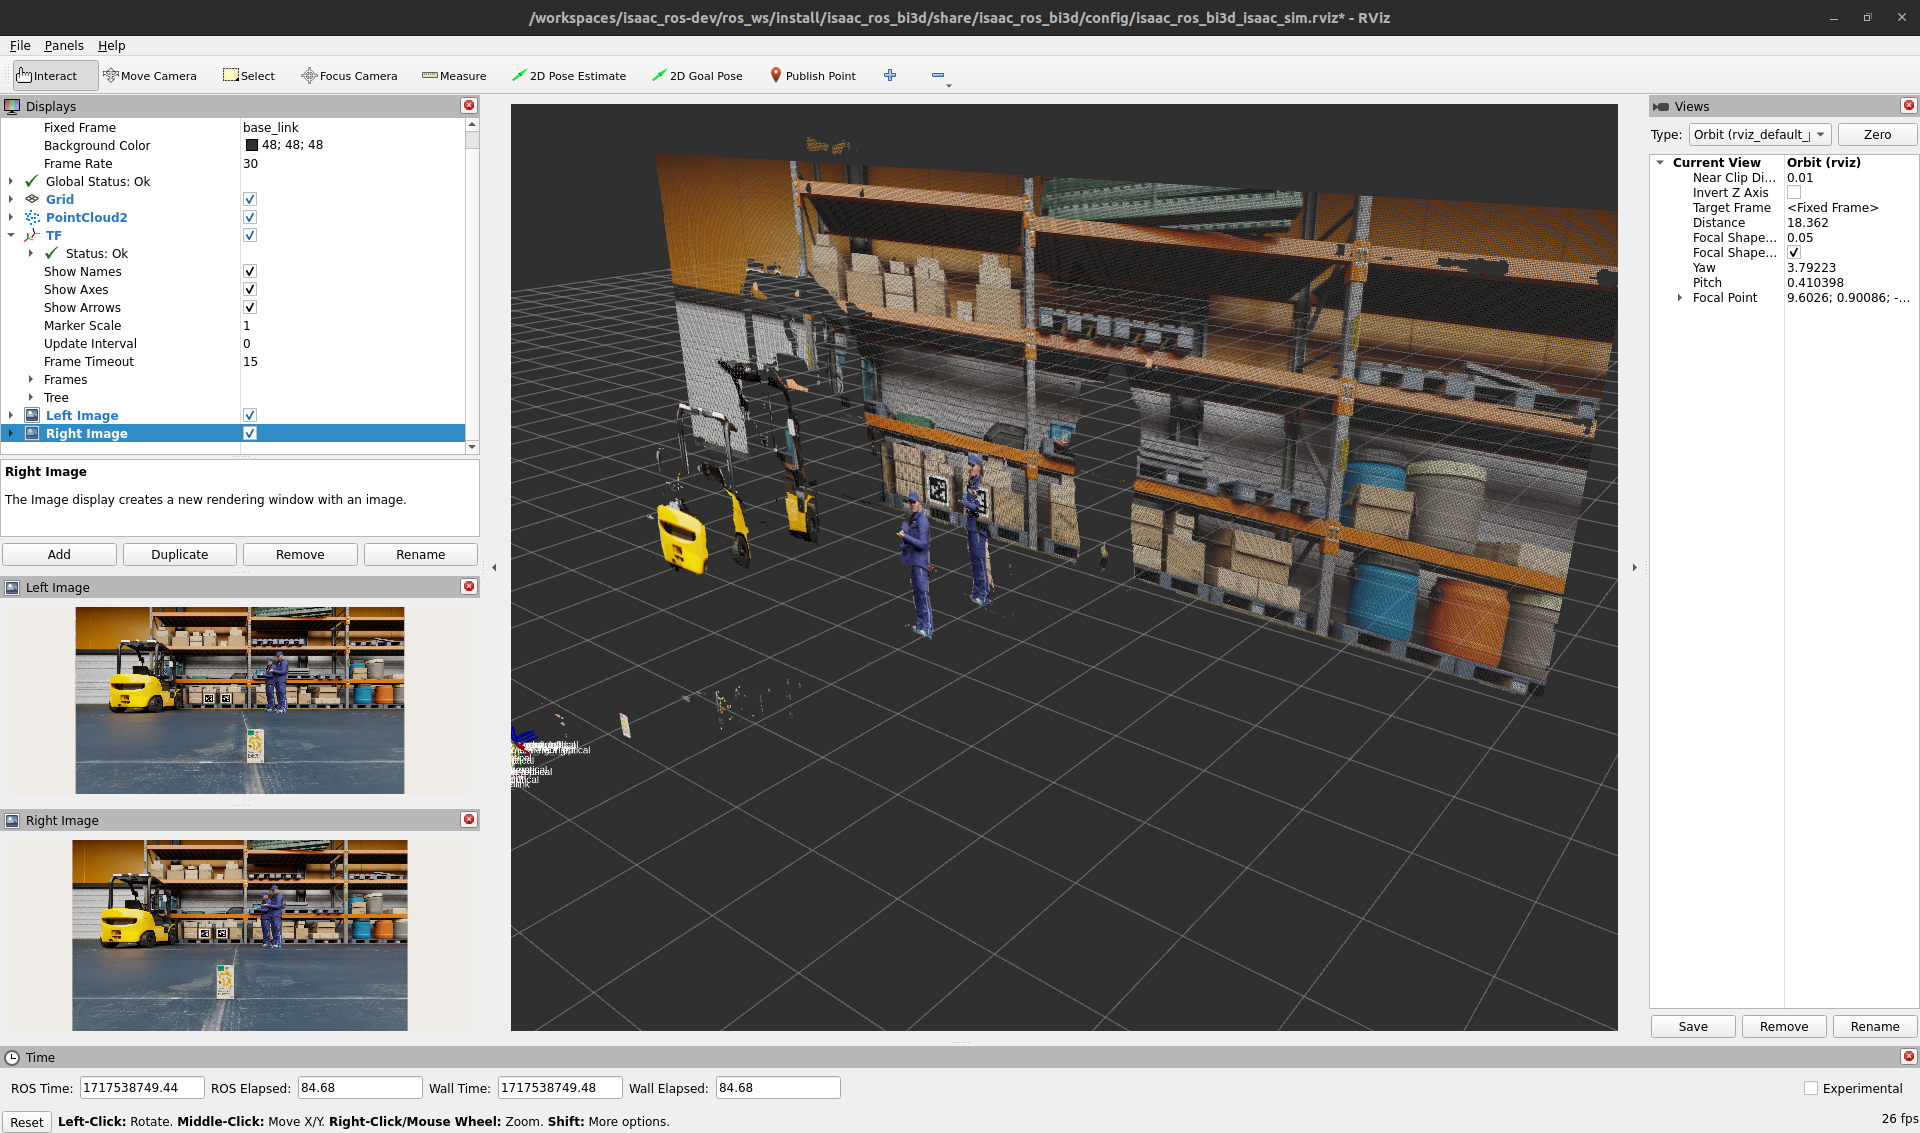
isaac_ros_bi3dnode using the launch files:ros2 launch isaac_ros_bi3d isaac_ros_bi3d_isaac_sim.launch.py \ featnet_engine_file_path:=${ISAAC_ROS_WS}/isaac_ros_assets/models/bi3d_proximity_segmentation/featnet.plan segnet_engine_file_path:=${ISAAC_ROS_WS}/isaac_ros_assets/models/bi3d_proximity_segmentation/segnet.plan
You should see a RViz window, as shown at the top of this page.
Optionally, you can run the visualizer script to visualize the disparity image.
ros2 run isaac_ros_bi3d isaac_ros_bi3d_visualizer.py